Data Warehousing and Reporting


Technology stack
Background
Objective
Requirements & Scope
- High scalability – The platform needed to be able to grow as the number of users accessing it increased over time.
- Security – Advanced security measures needed to be put in place in order to protect sensitive customer information from unauthorized access or manipulation by malicious actors.
- Performance – The platform should be capable of processing large amounts of data quickly without compromising on accuracy or reliability.
- Reliability – It should also have built-in redundancy measures so that if any component fails there would not be full system failure but rather just partial downtime until it can be restored again with minimal impact on operations.
Solution
To address these requirements an end-to-end solution was designed utilizing SQL as the primary database language along with Snowflake (a cloud-based data warehouse) and Power BI (a business intelligence visualization tool) technologies as its foundation pillars.
ETL process was mostly implemented by Snowflake's ETL tools, like pipes and tasks. Additionally, serverless functions such as AWS Lambda were employed where necessary in order to minimize operational overhead costs when dealing with things like ETL jobs which need frequent updates due to constantly changing source databases, etc. This approach allowed us not only to scale up quickly but also enabled us to enable automated processes when it came time handling incoming/outgoing datasets so there was less manual intervention needed thus resulting in improved performance overall.
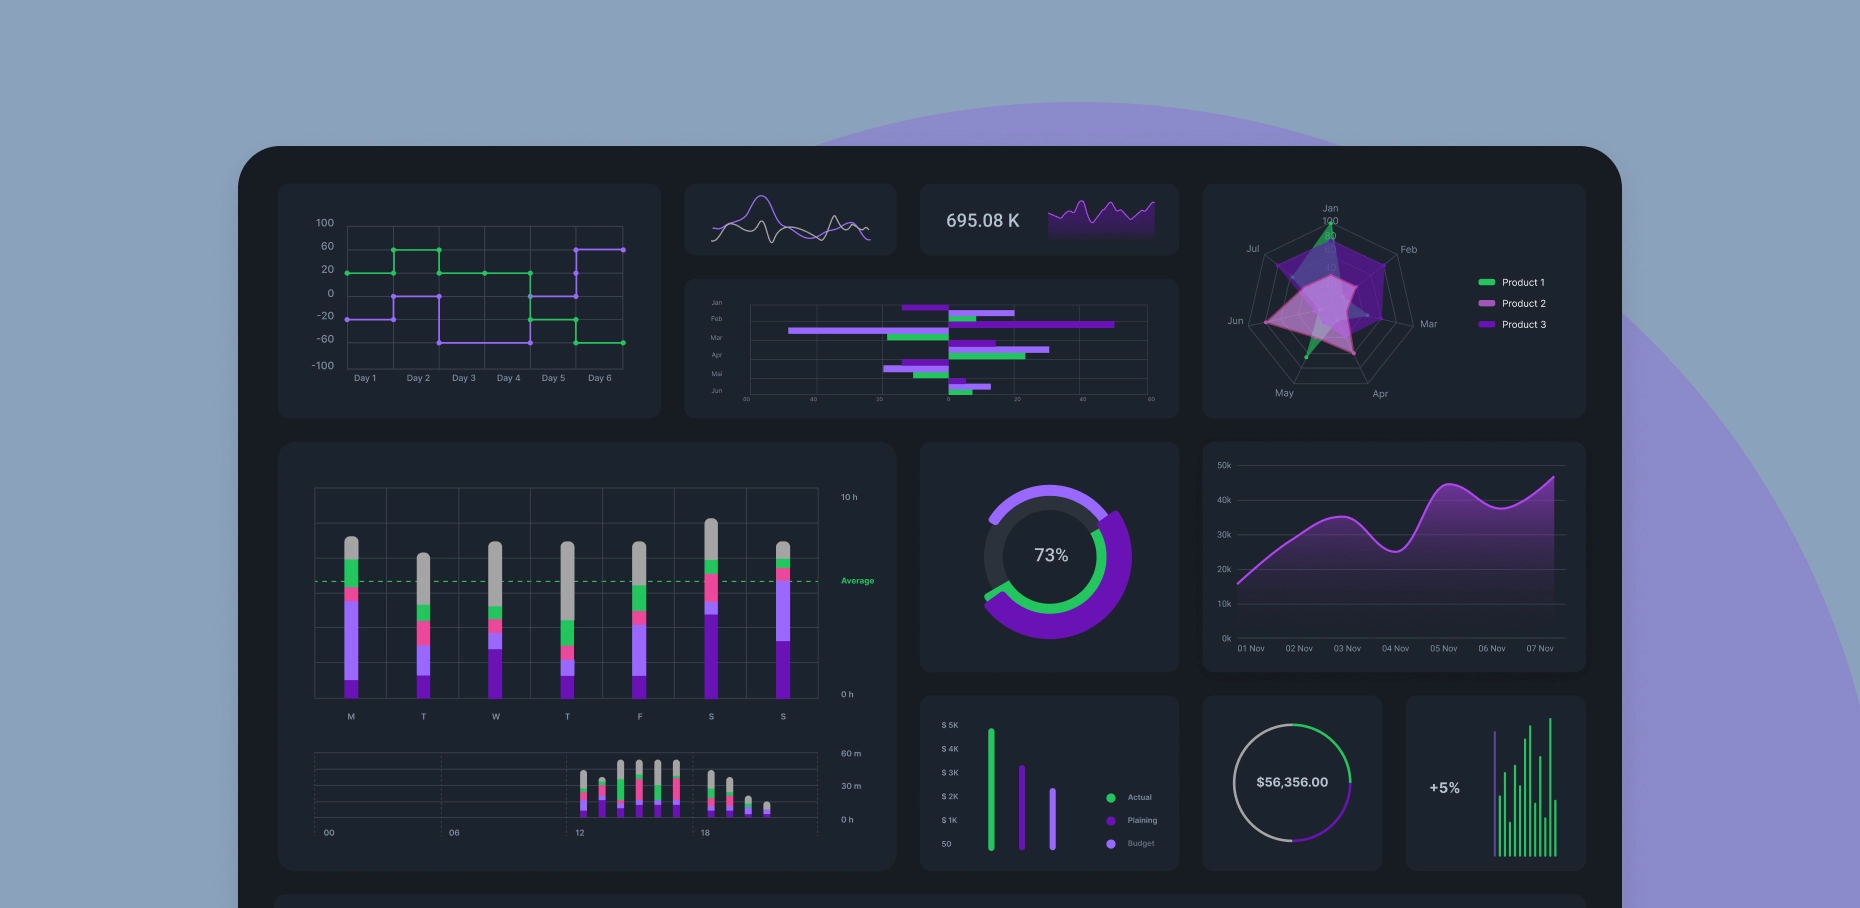
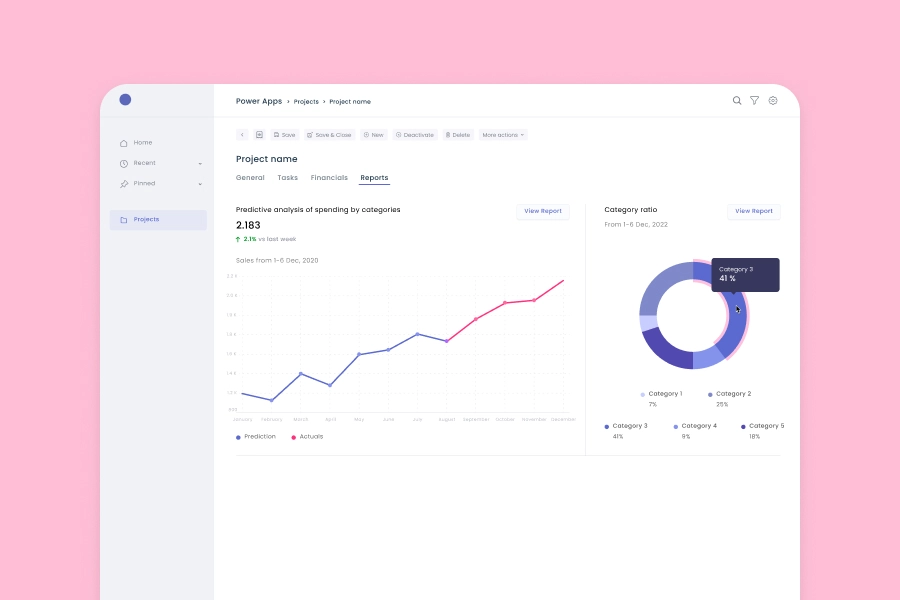
Finally, high performant reports were built with Power BI. Our BI team spent lots of effort analyzing and investigate customers' data and processes to provide meaningful data visualization and insights for the client. All reports were designed to match refresh rate requirements. The visual part of reports was made to smoothly integrate into the customer's corporate style.
Results
Finally, high performant reports were built with Power BI. Our BI team spent lots of effort analyzing and investigate customers' data and processes to provide meaningful data visualization and insights for the client. All reports were designed to match refresh rate requirements. The visual part of reports was made to smoothly integrate into the customer's corporate style.
In addition, since most components employed were cloud-based pay-per-use models, they were able to experience cost savings since they didn’t need to provision additional servers/hardware upfront before getting started. All things considered, implementing our proposed solution provided them not only tangible benefits immediate productivity gains but also long-term strategic advantages when comes competing market landscape going forward thanks to its flexibility and robustness.
Other projects
 E-commerce
Bokadirect
Bokadirekt, an e-commerce platform specializing in health and beauty bookings, sought to enhance its user search experience by developing a customizable search engine capable of swiftly handling vast data. Leveraging technologies like Node.js, .NET, React.js, and Elasticsearch, the new search engine introduced features like autocomplete and fuzzy search, and utilized machine learning to boost result relevance, resulting in heightened user satisfaction and loyalty.
 E-commerce
Marknadsplats
For the Swedish media company, Marknadsplats.se, a customized e-commerce platform was developed to facilitate secure and user-friendly digital transactions between buyers and sellers. Utilizing technologies like Node.js, React.js, and AWS, the platform offers features like secure payment processing, real-time messaging, and is optimized for desktop and mobile devices, ensuring a seamless user experience and adaptability for future business needs.
 Finance
Custom Financial Data Grid Control for Power Apps
A consulting firm specializing in project management services sought a solution for its inadequate Power BI visuals. To meet their need for custom, intuitive, and user-friendly visualizations of project timelines and KPIs, a set of tailor-made Power BI visuals, including a Gantt chart and KPI charts, were developed using TypeScript. The resulting visuals were fully integrated into the client's existing Power BI system, enhancing their reporting capabilities, fostering informed decision-making, and streamlining their workflow without switching between reporting tools.
Let’s discuss
your project!


